Imaging Data Quality
Here we compile some other quantifications about the quality and nature of the SDSS images.
Quality Flags
Most of the discussion below covers the overall quality of SDSS data. In order to evaluate the quality of individual fields, please see our description of image quality flags.
Seeing and Sky Brightness
Seeing and sky brightness affect both the completeness of the SDSS and the accuracy of its star/galaxy separation.
Seeing is given in SDSS photometry data as the psfWidth parameter. That parameter is defined as the single-gaussian FWHM that has the same noise effective area as the SDSS photo pipeline double-gaussian fit to the PSF. The sky error contribution to a PSF magnitude will be proportional to this effective number of pixels, which makes this measure useful for quantifying the completeness of point sources at the faint limit. See the imaging data file page for more information about the PSF definition and quantification.
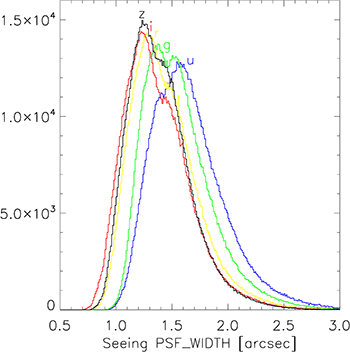
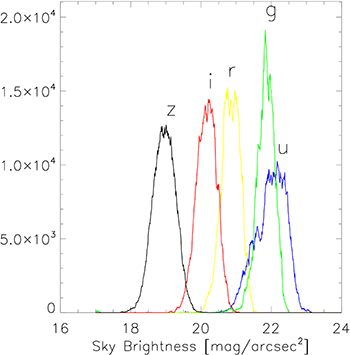
The following plots show the distribution of seeing for all imaging data (in DR8 and beyond), and the distribution of sky brightness for moon-down observations in those same data.
Here are the quantiles for seeing for SDSS observations in each filter (FWHM in arcsec):
Here are the quantiles for sky brightness for SDSS observations in each filter (magnitudes per arcsec2):
| Filter | 25% | 50% | 75% |
|---|---|---|---|
| u | 22.30 | 22.01 | 21.64 |
| g | 22.01 | 21.84 | 21.64 |
| r | 21.04 | 20.84 | 20.66 |
| i | 20.36 | 20.16 | 19.96 |
| z | 19.18 | 18.96 | 18.74 |
The median seeing of all SDSS imaging data (using the psfWidth metric) is 1.32 arcseconds in the r-band. The median seeing for BOSS galaxy targets classified as photoprimary is 1.1 arcseconds in the i-band (see Ross et al. 2011, MNRAS, 417, 1350).
Depths of the SDSS photometric survey
The median 5-sigma depth for SDSS photometric observations is:
- u = 22.15
- g = 23.13
- r = 22.70
- i = 22.20
- z = 20.71
This is based upon the formal errors from photo PSF photometry on point sources.
The 5-sigma point source depth can be accurately estimated per SDSS frame using a simple model of seeing, sky brightness and airmass as follows:
Flux(5-sigma) = A * PSF_FWHM * sqrt(SKYFLUX) * 10^(0.4*k*AIRMASS)
where
   A = [0.387, 0.218, 0.241, 0.297, 0.665] for [u,g,r,i,z]
   k = [0.49, 0.17, 0.10, 0.06, 0.06] for [u,g,r,i,z]
The overall scaling coefficients, A, have been determined empirically from the catalog errors. The atmospheric extinction coefficients, k, are from Padmanabhan et al. (2008).
The numbers per field needed for this are available in the public window_flist file, available through the Science Archive Server (SAS) and documented on the window_flist page of the SDSS Data Model, where the units of PSF_FWHM are in arcsec.
This formula predicts the 5-sigma depth to an RMS accuracy of [12%, 4%, 4%, 5%, 7%] in each band, which is quite good while ignoring atmospheric variations, flat-field vectors, mirror coating degradations and PSF shape variations.
Below are the quantiles of depths in linear units of nanomaggies at quantiles of 10%, 25%, 50% (median), 75% and 90%.
| Filter | Flux10% | Flux25% | Flux50% (median) | Flux75% | Flux90% |
|---|---|---|---|---|---|
| u | 1.053 | 1.189 | 1.386 | 1.650 | 1.974 |
| g | 0.447 | 0.497 | 0.562 | 0.652 | 0.775 |
| r | 0.659 | 0.735 | 0.835 | 0.973 | 1.163 |
| i | 0.999 | 1.130 | 1.315 | 1.573 | 1.918 |
| z | 3.939 | 4.461 | 5.203 | 6.150 | 7.327 |
Below are the same quantiles of depth converted into units of magnitudes:
| Filter | Flux10% | Flux25% | Flux50% (median) | Flux75% | Flux90% |
|---|---|---|---|---|---|
| u | 22.44 | 22.31 | 22.15 | 21.96 | 21.76 |
| g | 23.37 | 23.26 | 23.13 | 22.96 | 22.78 |
| r | 22.95 | 22.83 | 22.70 | 22.53 | 22.34 |
| i | 22.50 | 22.37 | 22.20 | 22.01 | 21.79 |
| z | 21.01 | 20.88 | 20.71 | 20.53 | 20.34 |
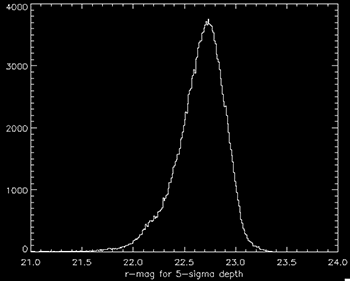
The image above shows a histogram of the photometric depth of SDSS imaging in the r-band, which peaks at r = 22.70.
Completeness of the SDSS photometric survey
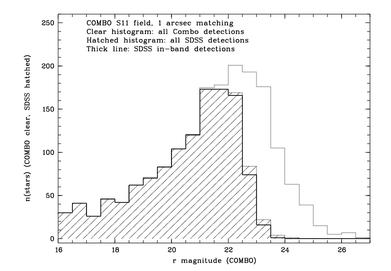
We have determined the completeness of the SDSS photometric survey by comparing the number of objects found by the SDSS pipeline to the number found by the COMBO-17 survey in a region of sky that has been scanned by both surveys, and in a second comparison with data from observations of a CNOC survey field. While the comparison was carried out for DR1 data, the DR2/DR3 data are not significantly different.
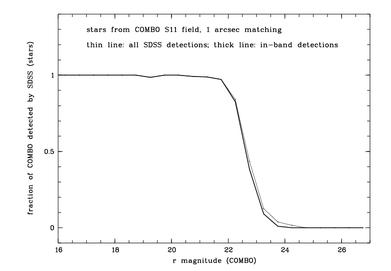
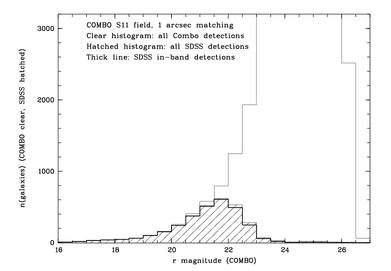
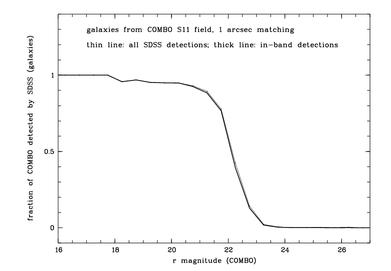
Here we show details for the comparison with COMBO-17 data. The region of sky used here for calibration is COMBO-17's S11 field, which is covered by run 1140, camcol 5, fields 151-154 and run 1231 camcol 5 and 6, fields 42-45.
The sky brightness in over half the SDSS is better than it is in these fields, and the seeing in most of the survey is better than it is in one of these runs, so the completeness in most of the survey should be better than what is shown here. See the seeing and sky brightness table for COMBO-17/SDSS overlap below.
In the following plots, PSF r-band magnitudes are used for stars, and Petrosian r-band magnitudes are used for galaxies.
Note that COMBO-17's multicolor classification starts to become incomplete for stars at about one magnitude fainter than SDSS. Therefore, the SDSS 50% completeness is slightly brighter than indicated by this plot.
The number of objects above the 5-sigma detection threshold depends heavily on the seeing and sky brightness in a given field. The following table summarizes the seeing and sky brightness in the overlap region.
| run | camcol | field | seeing [arcsec] | sky brightness [mag/sq. arcsec] |
|---|---|---|---|---|
| 1140 | 5 | 151 | 1.293 | 20.8210 |
| 1140 | 5 | 152 | 1.273 | 20.8210 |
| 1140 | 5 | 153 | 1.280 | 20.8150 |
| 1140 | 5 | 154 | 1.331 | 20.8060 |
| 1231 | 5 | 42 | 1.941 | 20.7670 |
| 1231 | 5 | 43 | 2.051 | 20.7670 |
| 1231 | 5 | 44 | 2.052 | 20.7700 |
| 1231 | 5 | 45 | 2.011 | 20.7710 |
| 1231 | 6 | 42 | 2.010 | 20.7740 |
| 1231 | 6 | 43 | 2.113 | 20.7750 |
| 1231 | 6 | 44 | 2.122 | 20.7750 |
| 1231 | 5 | 45 | 2.033 | 20.7780 |
Star/galaxy separation
The SDSS photometric pipeline performs a morphological star/galaxy separation. The quality of this separation is therefore intimately related to the seeing and sky brightness. Photo's classifications have been tested against those of the COMBO survey (which effectively uses low-resolution spectroscopy for star/galaxy separation) in a region of the sky that both surveys have scanned. While the comparison was carried out for DR1 data, the DR2/DR3 data are not significantly different.
We assess the quality of the SDSS star/galaxy separation using the COMBO S11 field which corresponds to SDSS run 1140 camcol 5 fields 151-154, run 1231 fields 42-25 camcols 5-6. We assume the COMBO classification is correct and determine which fraction of SDSS-detected objects is classified identically by SDSS.
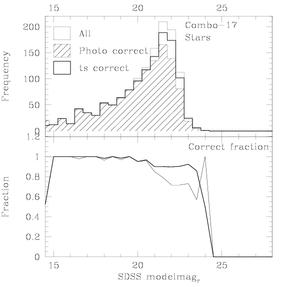
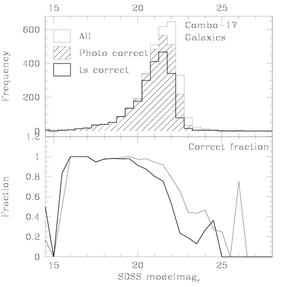
To see how the seeing and sky brightness of these fields compare to the rest of the SDSS, look at the seeing and sky brightness in the SDSS/COMBO overlap region.

